WebRTC Quality Analytics
Databricks App · Coming to Databricks Marketplace

Call quality analytics that never leaves your lakehouse.

Drop a chrome://webrtc-internals dump and get E-model MOS scores, per-second call timelines, fleet-wide breakdowns, and AI root-cause diagnosis — running 100% inside your own Databricks workspace. Zero external egress.

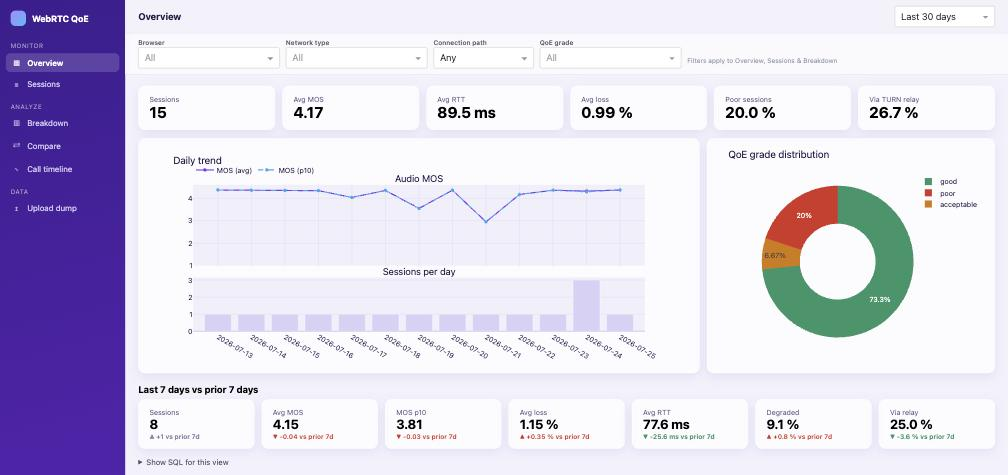
Overview screen: fleet QoE summary, daily MOS trend, grade distribution and 7-day regression check
Storage is your Unity Catalog. Compute is your SQL warehouse. Even the AI diagnosis runs on your Model Serving. Nothing is sent anywhere else.

Why teams pick it

SaaS-grade call monitoring, without handing your call data to a SaaS.

Zero egress by design

No external domains declared, no telemetry collected. TURN credentials are redacted and SDP bodies dropped at parse time. Works with Meet, Teams, or your own WebRTC app.

Plain Delta tables, not a black box

W3C getStats-compliant medallion schema in your Unity Catalog. JOIN call quality with your business data, copy any view's SQL into the SQL editor, or use the bundled AI/BI dashboard.

From MOS to root cause

ITU-T G.107 E-model scoring per stream, 10-second window, and session. One click asks a foundation model in your workspace for a diagnosis that cites the evidence.

Product tour

Four views from "how is the fleet" to "why was this call bad".

Breakdown

Find the systemic pattern.

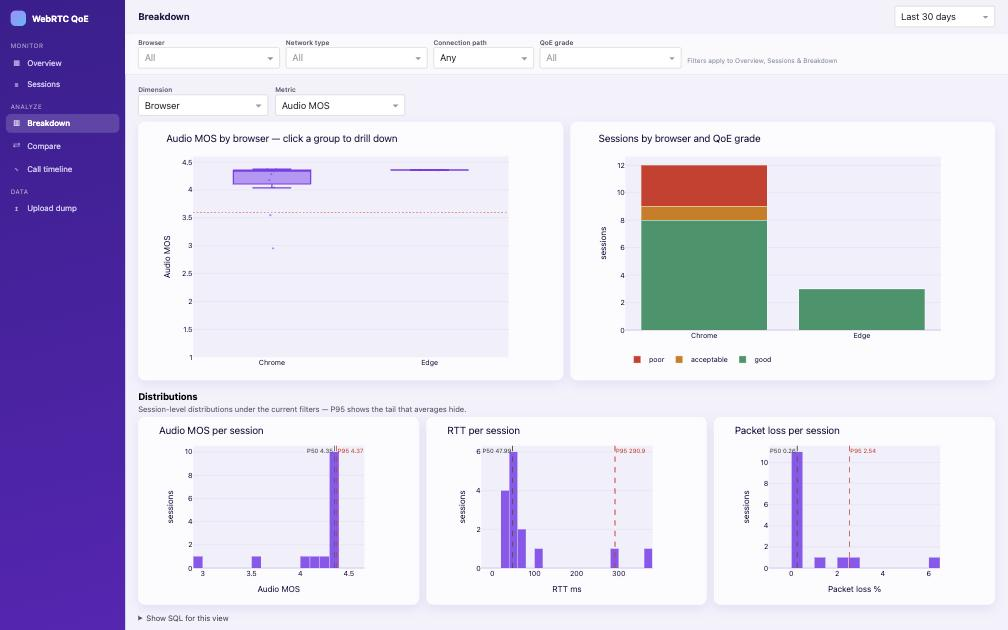
Slice MOS, loss and RTT by browser, OS, network type, TURN usage, weekday or hour — box plots with per-group drill-down, and P50/P95 histograms that show the tail your averages hide.

Breakdown screen: box plots per browser and QoE-grade stacked bars, with distribution histograms
Compare

Put a bad call next to a good one.

Two sessions side by side: metric deltas in a table, full timelines below. The degraded intervals light up on one side and not the other — that difference is usually your answer.

Compare screen: a good call and a poor call side by side with degraded intervals shaded
Call timeline

Per-second forensics.

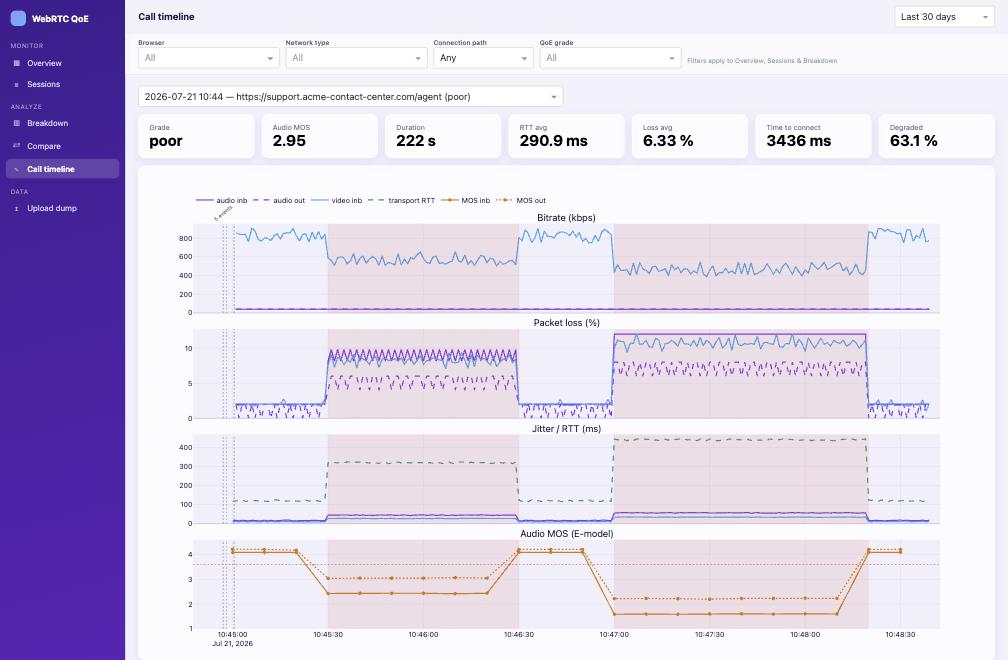
Bitrate, loss, jitter/RTT and MOS at one-second resolution, with ICE and connection events overlaid and degraded windows shaded. Setup bursts are clustered so the chart stays readable.

Call timeline screen: per-second charts of a poor session with degraded windows shaded red
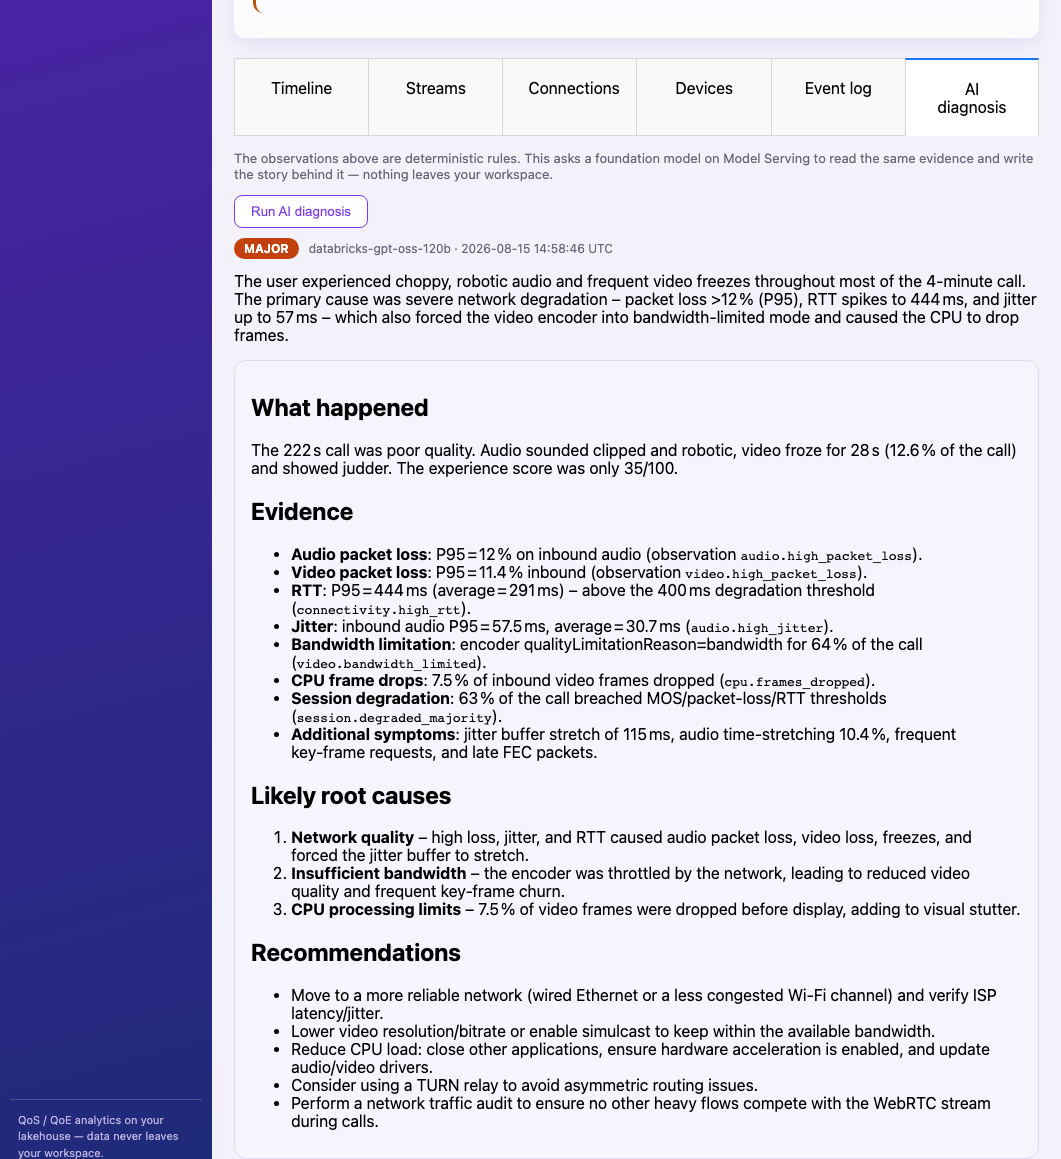
AI diagnosis

An incident report, written for you.

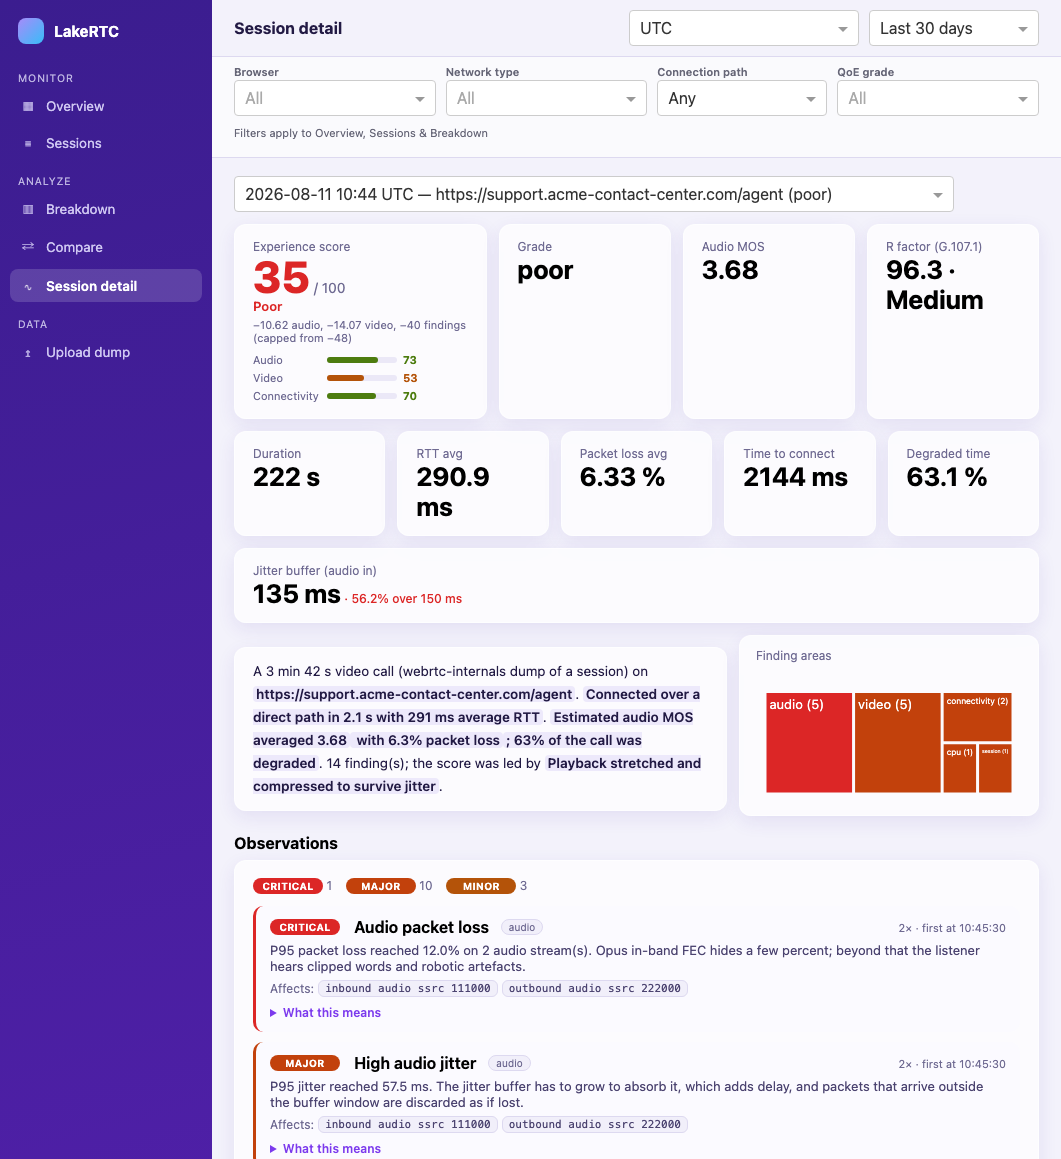
Severity, what happened, evidence with concrete numbers, likely root causes and recommended actions — generated by a foundation model running in your workspace, stored as history next to your data.

AI diagnosis panel: CRITICAL badge with an evidence-citing markdown report

How it works

From install to first insight in about ten minutes.

Install from Databricks Marketplace

Free listing. Map two resources — your SQL warehouse and a pay-per-token model endpoint — and run the bundled DDL.

Drop a webrtc-internals dump

Export from chrome://webrtc-internals during any call and drag it into the app. Parsing, normalization and QoE scoring run automatically.

Explore — or let the AI explain

Fleet overview, breakdowns, comparisons, per-second timelines, and one-click root-cause diagnosis on the calls that need it.

Roadmap: a TypeScript collection SDK for continuous monitoring feeds the exact same tables — everything you build on the gold schema today keeps working.

Built for

The people who get asked "why was my call bad?"

Contact-center operationsTie QoE to agents, sites and carriers; investigate tickets with per-call evidence.
Platform & SRE teamsWatch fleet MOS, TURN rates and week-over-week regressions next to the rest of your lakehouse.
Telehealth & online educationQuality data stays inside your compliance boundary — nothing leaves the workspace.

Coming to Databricks Marketplace.

Want early access, a demo with your own dumps, or a heads-up when the listing goes live? One email is enough.